By Mia Wang & Jeff Allen
The Eglinton Crosstown LRT (Line 5) in Toronto is expected to open on February 8. The 19-kilometre, 25-station line will run between Kennedy Station in the east and Mount Dennis in the west.
We wanted to understand how development has evolved along the corridor during its construction period. To what extent has transit-oriented development (TOD) occurred, and where has it been concentrated along this route?
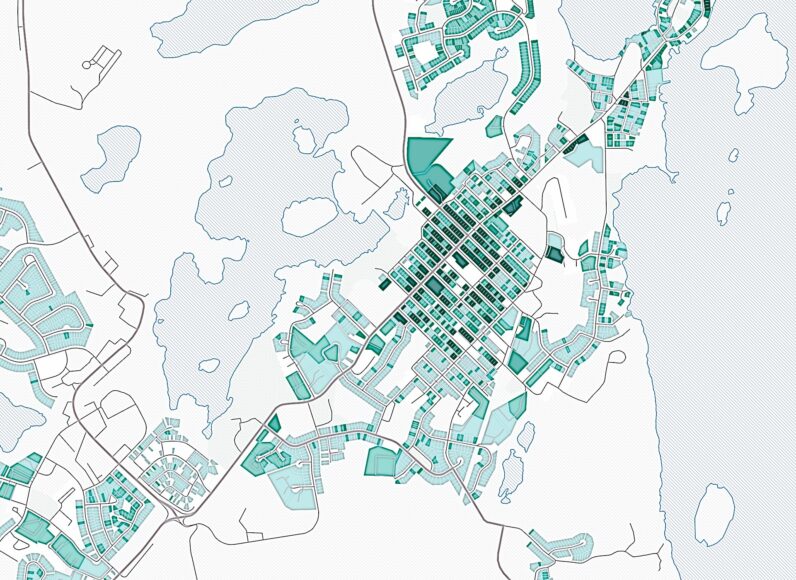
To do so, we mapped differences in building massing data (i.e. 3D shapes of buildings) from two time periods, 2013 and 2025, to visualize changes within an 800-metre buffer of transit stations along the line. 800m is roughly a 10-minute walk from each station.
We looked at changes in development using two indicators from this data: floor area change and volume change, where volume is calculated as floor area multiplied by building height. Together, these metrics capture not only how much development has occurred, but also how intensively land is being used.
Zooming in on midtown stations reveals a clear pattern: most new development, shown in green in the graphic below, consists of high-rise residential or commercial buildings, while surrounding single-detached neighbourhoods show relatively little change.
Click on the graphic to view at a higher resolution.

These stations are also located close to one another – Eglinton and Mount Pleasant are approximately 700 metres apart, while Eglinton and Avenue are just over 800 metres apart – creating overlapping catchment areas that intensify development pressure in this section of the corridor.
The horizontal skyline visualization below shows buildings within the 800-metre buffer along the Eglinton Crosstown LRT, looking north, across the entire line. New buildings constructed between 2013 and 2025 are highlighted, while areas without buildings correspond to parks, valleys, or other open spaces. Building heights are scaled by a factor of two to improve legibility at this regional scale.
Click on the graphic to view at a higher resolution.

The bar charts below show percentage changes in floor area and volume for each station along the LRT line.
Overall, changes in volume are more pronounced than changes in floor area, reflecting a broader trend toward taller and denser development rather than horizontal expansion.
Bar height represents absolute changes in area or volume, while bar shading indicates percentage change. Consistent with the map, most growth is concentrated in midtown stations and Mount Dennis. Several stations, including Fairbank, Don Valley, and Golden Mile, show a decrease in total floor area alongside an increase in volume. This pattern likely reflects redevelopment processes where older, low-rise industrial or commercial buildings were demolished and replaced with fewer but significantly taller and denser structures.
Click on the graphics to view at a higher resolution.


Nearly every station experienced an increase in building volume, with the exception of Golden Mile and Birchmount at the east end which have a very slight decrease. Note that decreases in volume could be due to a lower-rise building being torn down prior to a new building being erected. i.e. the property would appear empty in the 2025 dataset during this intermediary construction period.
Stations in midtown – particularly Eglinton, Mount Pleasant, and Leaside – show the largest percentage increases in area, along with Mount Dennis at the west terminal. These locations appear to be key focal points of intensification along the corridor.
Data challenges and limitations
Comparing building massing across time presented several technical challenges.
The first to note is that the line started construction in 2011 and was completed in 2026, while the earliest building massing data available was from 2013 and the latest from 2025. So our analysis would be missing any building from the 2011-2013 period and any buildings that completed in late 2025 and early 2026. Thus these graphics do not account for the entire ‘under construction’ period of the line.
The 2013 dataset includes only basic building footprints with simplified height values, while the 2025 dataset contains detailed roof geometries and more precise height measurements. As a result, even unchanged buildings often appear with height differences of 0.5 to 5 metres between the two files.
By comparing the massing data with historical aerial imagery, we found that for most long-standing single-family homes, building elevations in the 2013 dataset are consistently higher, typically by about 0.5 to 1.5 metres. This discrepancy produced widespread false negative volume change when calculating raw differences, particularly outside of downtown Toronto. To correct for this systematic bias, we adjusted the 2013 building heights by subtracting 1.1 metres across the dataset.
Another challenge arises from the high level of detail in the 2025 massing data. Complex roof geometries generate thousands of overlapping polygons, which can result in area and volume being counted multiple times. To ensure consistent measurement across space and time, we applied a grid-based approach. A uniform 5m by 5m grid was generated across the City of Toronto, and the maximum building height intersecting each grid cell was assigned using a spatial join. Each cell therefore represents 25 square metres of area, with volume calculated as 25 multiplied by the assigned height. This method was applied consistently to both the 2013 and 2025 datasets.
Using this standardized framework, we calculated absolute and percentage changes in area and volume for each station catchment within the 800-metre buffer.
Appendix: Additional map of development change 800m from Eglinton Crosstown LRT stations